Customer Perceptions of Digital/Mobile Services: South Africa – 2023

Utilising our own AfricanPulse online community, we surveyed 782 digitally-savvy mobile device users, receiving representation across age, gender, race, geographic area and living standard groups within South Africa.
We asked them about their mobile/digital service usage, barriers and perceptions, relating to multiple industries. We covered topics such as value propositions, data privacy and security, and customer-centricity amongst others.
KEY INSIGHTS
The Future is Personal
The South African consumer market is in a state of flux, with significant changes in the economic, socio-cultural and political landscapes influencing consumer behaviour.
It is clear that changing market conditions are impacting the South African consumer, who expects an individualized, seamless and sustainable customer experience.
In a recent survey caried out by IQbusiness Insights, over 70% of respondents indicated an expectation of more personalised services at the same or cheaper cost.
Trust and Functionality Suggest Room for Improvement
Combined with a relatively high distrust of digital channels (46% of respondents, when compared to face-to-face or call-centre interactions), our research suggests service providers have some areas for improvement.
Significant use cases for digital mobile engagement, namely Billing Enquiries (45% of respondents) and Technical Enquiries (42% of respondents) show high rates of service difficulty.
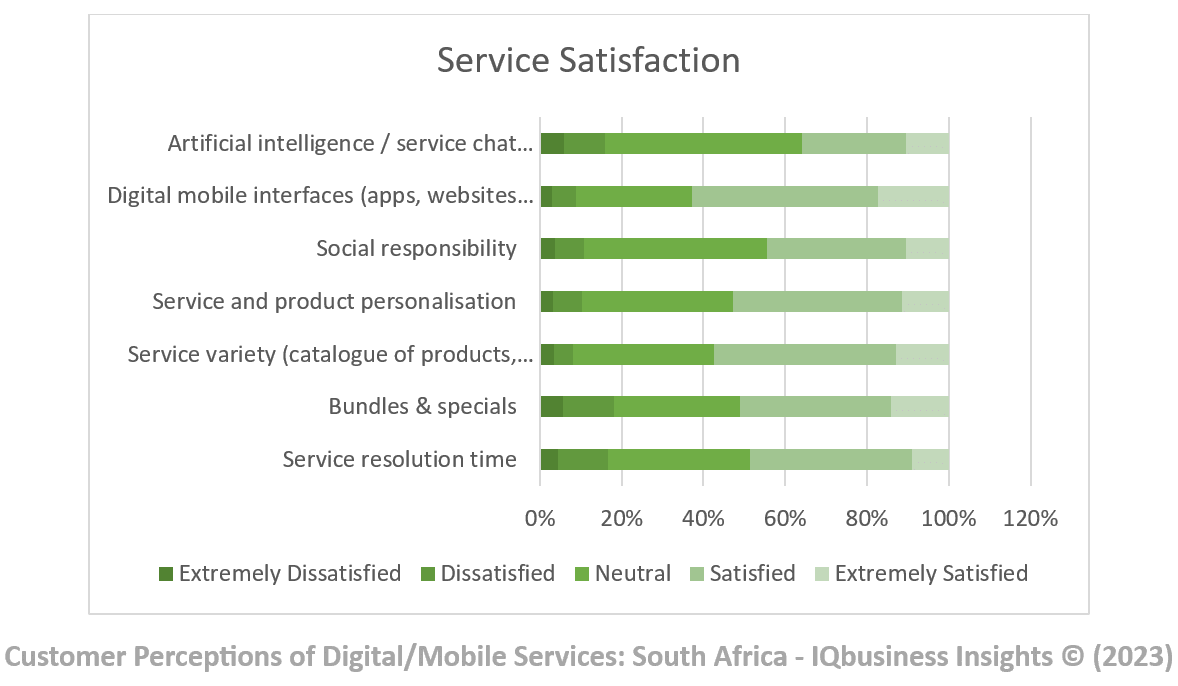
In terms of service satisfaction, Service Resolution Time, and Bundles & Specials appear to be two areas falling behind, which indicate areas ripe for disruption.
Hard work however does appear to have paid off: while facilitating payments (72% of respondents) is the most common use across industries, it also appears to be one of the easiest.
Significant Barriers Exist, but Opportunity Abounds
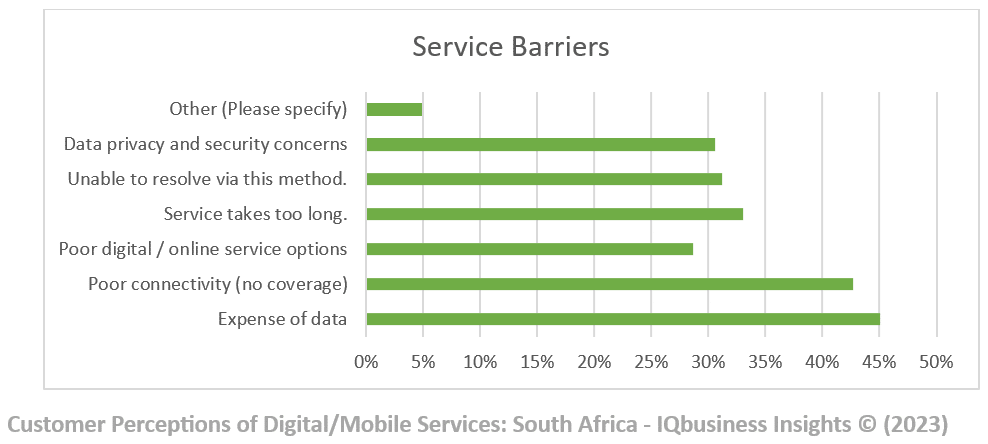
The biggest barriers overall, unsurprisingly, are Expense of Data (45%), and Poor connectivity / no coverage (43%). Perhaps still more concerning however are Service Takes Too Long (33%), and both Unable to Resolve via This Method and Data privacy and Security Concerns each reported by 31% of respondents.
In terms of industry penetration, Banking and Telecommunication Service Providers are a step ahead of the rest in terms of usage, and perception of functionality, innovation and customer experience.
Research suggests that Insurance providers have the greatest opportunity for improvement, with lowest scores reported across all aspects assessed.
What you say matters
The data shows a significant variance in perception of the importance service providers place on protecting personal data, privacy, usage behaviour, and other information from misuse or leaking to the public or competitors.
In terms of other topical issues, an overwhelming majority of respondents indicated that a service provider’s public position on environmental and social issues was important.
Technology is a Journey, not a Destination
Technology and digital enablers were also covered, with respondents rating their perception of the impact Artificial Intelligence, Robotic Process Automation, and Chatbots will have on customer experience. Response once again varied, but suggested a significant need for ongoing education and positive experience to reinforce adoption.
Introduction
The past few years have seen multiple disruptions to business, each unprecedented in democratic South Africa’s brief history.
A global pandemic, civil unrest, and record-breaking load shedding have left deep scars on the economy, evidenced by growing inflation, and weakening currency.
Organisations, both brick & mortar and digital alike have been scrambling to maximise market share and reduce their cost to serve, all while battling against deterioration of state infrastructure.
It is no surprise then that many organisations are turning to digital channels, that for many promise to recapture the connectedness and service excellence customers demand. But are these efforts paying off?
This Report
The aim of this research was to gauge perceptions of current digital/mobile service users, across multiple industries, and usage categories. Assessing aspects such as preference, functionality, usage barriers, trust and loyalty, we have been able to identify various themes and trends. Demographic detail provides further unique insight relevant to key user groups.
This report sets out key findings, to inform targeted action and drive improvement in digital customer experience.
Research Methodology & Demographics
This survey utilised IQbusiness Insights’ AfricanPulse Online community. Our quantitative self-completion survey is captured via mobile, laptop or desktop, by a sample sourced from our own insights panel. There are no incentives per complete: Respondents are entered into a lucky draw only.
Our target profile was “Digitally-Savvy”, defined as smart-phone and digital application users. Age ranged from 18 to 45+, Living standard Measure (LSM) 1-10, all races and all provinces across South Africa. The questionnaire was distributed in English, and data was captured between 21st and 30th August 2023. Respondents: n=782
Quick Stats:
- 9 out of 10 digitally-savvy South African consumers utilise mobile/digital interactions with Banks, compared to 5 out of 10 with Insurers
- Banks are perceived as almost twice as competitive and innovative in terms customer-centricity, when compared to Telcos and online retailers.
- 3 out of 10 digitally-savvy South African consumers note “data privacy and security concerns” as a barrier to use digital / mobile channels.
- More than 4 out of 10 digitally-savvy South African consumers cite expense of data or poor connectivity as barriers to use digital / mobile channels
- Over 80% of digitally-savvy South African consumers believe a service providers public position on social and environmental issues is “fairly” to “extremely” important.
- Only 50% of digitally-savvy South African consumers believe that Artificial Intelligence (AI) will improve customer experience.
- 3 out of 10 digitally-savvy South African consumers believe Chatbots will make customer experience worse.
- Roughly 40% of digitally-savvy South African consumers express difficulty in using digital / mobile methods for technical enquiries, and service troubleshooting.
- Roughly 30% of digitally-savvy South African consumers express difficulty in using digital / mobile methods for activations, upgrades and downgrades.
- Only 53% of respondents indicated that they would rather use digital service resolution over face-to-face methods or traditional call centres, provided all functionality was equal.
- 54% indicated they felt distrustful, or feel more at risk during mobile / digital interaction than during face-to-face or call-centre interactions
These were the additional highlights:
- Banks and Telcos lead usage, telcos fall behind in terms of perceived functionality and perceived innovation of customer-centricity.
- Online retailers, although high in usage, are not regarded as highly in terms of perceived functionality and perceived innovation of customer-centricity.
- The Insurance industry lags far behind others in terms of usage, perceived functionality, and perceived innovation of customer-centricity.
- Payments, General Information and Everyday Transactions are reported as relatively frictionless.
- Usage and Billing queries, Service Troubleshooting, and Technical Enquiries, show high levels of frustration.
- Service Activations / Upgrades / Downgrades are unnecessarily hard, and pose significant risk to customer attrition.
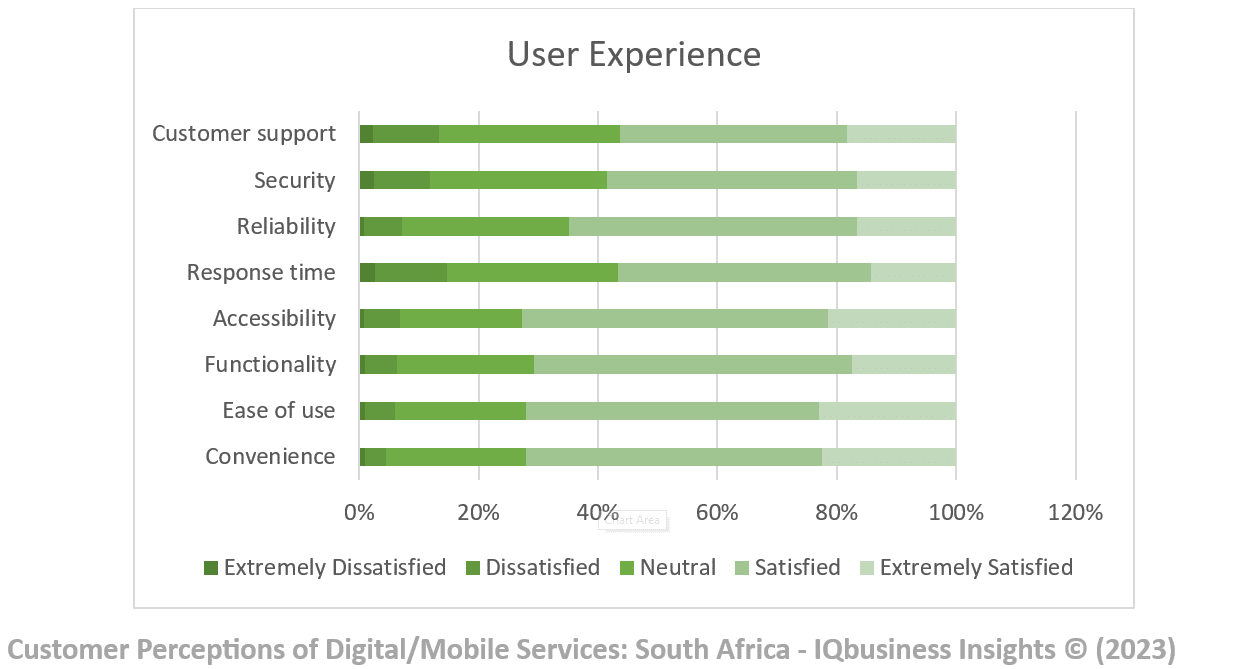
- Application User Experience (accessibility, functionality, etc.) is generally favourable, but customer support and response time show opportunity for improvement.
- While high data costs and poor connectivity are obvious barriers to usage, a significant percentage of digital/mobile service users say it just takes too long, or doesn’t resolve their queries.
- There is an increasing expectation of individualised / personalised service
- A company’s public position on social and environmental issues is “Extremely Important” to a large majority of respondents across all demographics, but specifically in middle income and LSM groups
- Respondent’s views are very mixed when asked how much they feel service providers value and protect their personal data against misuse.
- Contrary to the huge investment in mobile / digital channel technology, this does not on average appear to be positively influencing consumers perception of innovation and customer-centricity.
- Having said this, consumers are generally favourable of the potential role that Chatbots will have on Customer Service. They are somewhat more on the fence in terms of RPA and AI, with high levels of unfamiliarity.
Detailed Results
Industry Penetration
Banks And Telcos
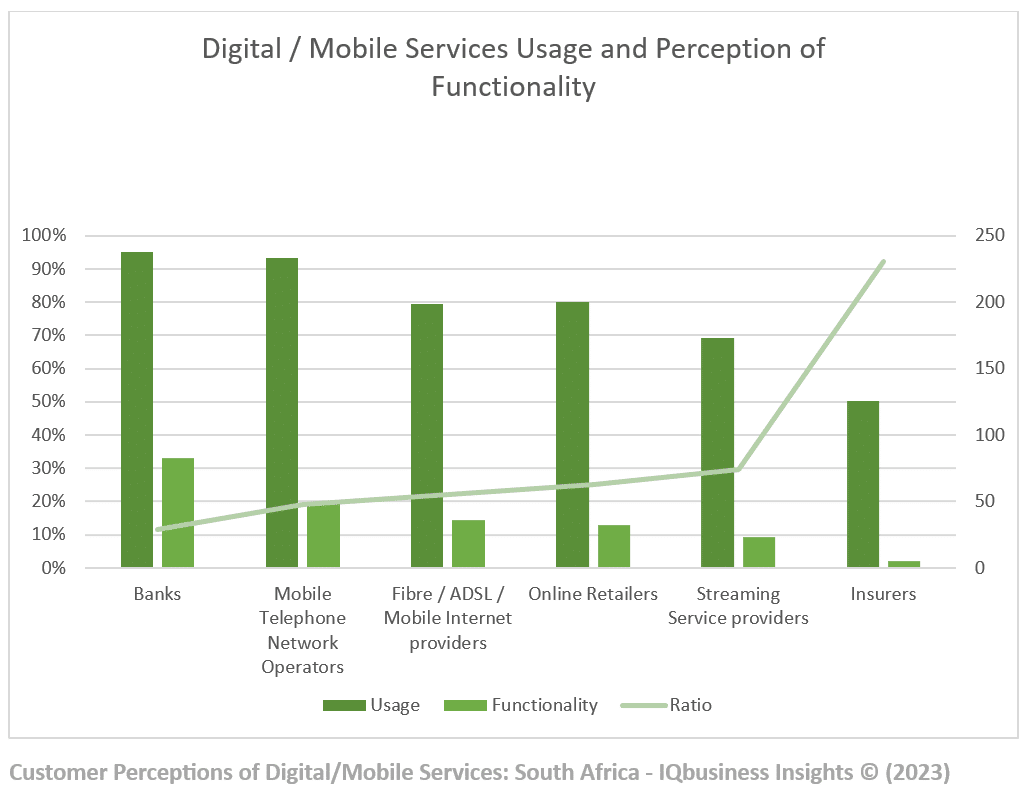
Of the 6 industry groups included in our survey, Banks (95%) and Mobile Telephone Operators (Telco’s: 93%) were clear leaders in digital / mobile services usage. Reflective of well-developed business models, and large investment, these industries show a near complete engagement within the digitally savvy segments of the economy.
While there are some interesting insights in the demographic data (age, gender, geographic location etc.), the distribution is fairly consistent across segments surveyed.
Online Retailers
Showing a relatively high average penetration (80%), the category of Online Retailers displays more differentiation in usage profile. While this illustrates the growth potential of e-commerce and online shopping, it’s appeal still appears to be limited to older and higher LSM consumer groups.
Fibre / ADSL / Mobile Internet provider/s
In a surprising result, an impressive 70% of respondents indicated engagement with this industry segment through mobile / digital channels. Further research would be beneficial to understand industry-specific usage behaviour, barriers and perceptions.
With many more, new, small and entrepreneurial players in this space however, it is likely that day-to-day customer interaction has been designed as “digital-first”, fast-tracking user adoption.
Streaming Service Providers
In another industry well-known for digital-first customer service, 69% of respondents indicated mobile / digital engagement with Streaming Service Providers. With usage barriers and disposable income perhaps a larger determinant of usage that in other industries, demographic distribution is unsurprisingly quite isolated within higher LSM groups.
Insurers
Showing a significant gap from large corporate siblings, the insurance sector shows the lowest penetration of mobile / digital engagement (50%) amongst our respondents. This is perhaps indicative of the historically trust and relationship-based business models within this segment. The usage profile of those who do make use of digital/mobile channels however (age 45+) are not those typically associated with the “digitally savvy” generation.
More research could be useful here, particularly in light of common services use cases and difficulties discussed below.
Services Usage & Difficulty
We assessed the relative usage reasons and difficulty through a number of questions. The combination of these results provide insight as to the perceived performance by users across these areas.
Payments
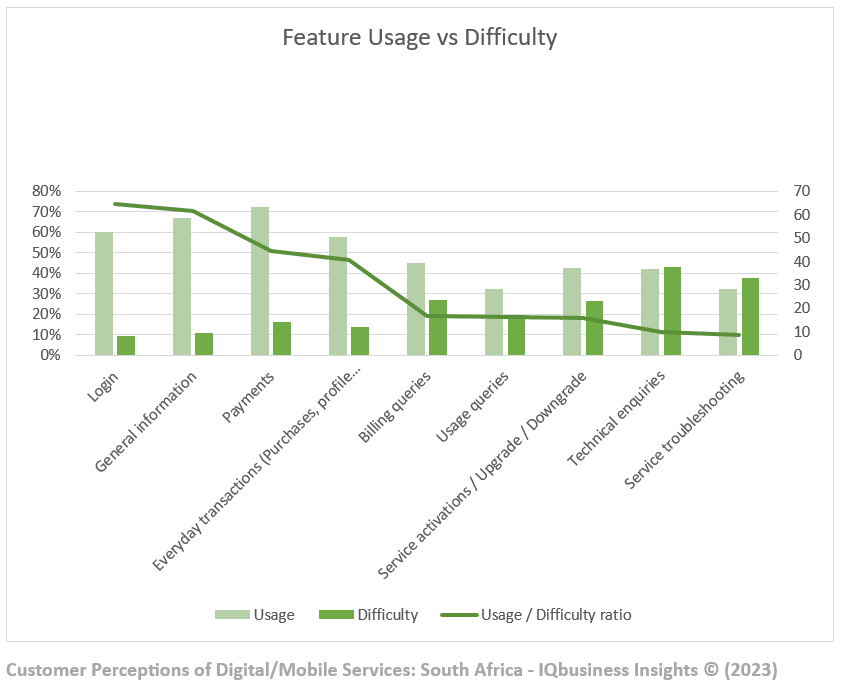
Of the 9 generic usage options provided across industry, Payments (72% of respondents) was the most frequently cited. A subject of much talk and investment, specifically in the financial sector, organisations will be pleased to hear their efforts appear to be paying off: Only 16% of respondents indicated this as an area of service difficulty. It is however useful to note this still marginally exceeds Everyday Transactions (14%) in terms of difficulty.
General Information and Everyday Transactions
It is notable that the second most common usage category is General Information (67%). Service difficulty is only cited by 11% of users, suggesting this functionality is well relatively well delivered across industries.
Basic everyday transactions and usage activities such as logins, profile configuration, purchases etc. show common usage (57%). Response also shows that these activities are relatively frictionless, with less than 15% expressing difficulty in these areas.
Billing Queries and Technical Enquiries
The next two highest cited usage categories are Billing Enquiries (45%), and Technical Enquiries (42%). It would however appear that more complex use cases present a more challenging experience, with Technical enquiries (43%) and Billing Queries (27%) also featuring at the top of the “Difficulty” list.
Service Activations / Upgrade / Downgrade
While also cited as a common use case (38%), Service Activations/Upgrades/Downgrades are also near the top of the list reported in terms of difficulty (27%). Given that this is often a key point at which loyalty-affecting interactions are had, this should be seen as a key indicator of usage and adoption.
The relatively consistent distribution of this finding across age, LSM and other demographic data suggests that this is a common process challenge across industries.
Usage Queries & Service Troubleshooting
While Usage Queries are only cited by a smaller percentage of users (32%), service difficulty is indicated by a relatively similar amount (20%) in comparison with other use cases.
On the other hand, Service Troubleshooting, indicated as a common use for 32% of respondents, is indicated as a difficulty by 38% – second only to Technical Enquiries. This may provide additional insights when compared to call-centre reason-codes for a specific organisation, but is suggestive of a potentially problematic use case.
Service Barriers
Our survey asked respondents to indicate the main reasons that prevent them using mobile / digital means of engagement.
Expense of Data
It is perhaps no surprise that Expense of Data is the most commonly cited service barrier (45%) across the board, with a significant impact on younger age groups and lower LSM categories. Addressing data affordability could be a major priority for service providers. This is particularly critical for those that rely on online transactions (Online retailers) or usage (Streaming Services) for generating income.
With cost of face-to-face and call centre interactions typically higher than digital engagement however, unresolved service challenges are highly likely to impact customer retention for all sectors.
Luckily, there is no shortage of innovative ideas that can be used to solve this problem on a tactical basis for a particularly valuable segment.
Poor Connectivity / No Coverage
This challenge (reported by 43% of respondents), while having a similar effect to high data costs, is not something that can be solved as easily. While reportedly worse in more rural provinces, this still appears to be a significant challenge across country, and is felt in all LSM groups.
This category provides a significant long term barrier to mobile / digital service adoption which cannot be ignored or underestimated in experience design.
Service Takes Too Long
This category indicates a potential challenge in communication through digital channels, whether via email, webchat or even whatsapp. A total of 33% of respondents indicated that service takes too long. This suggests that automated or digitally-enabled engagement is not necessarily quick enough, even if it saves them money and is cheaper to offer.
Unable to Resolve via This Method
On average, a surprisingly high percentage of respondents (31%) indicated that they were not able to resolve their query via the chosen digital / mobile method. This could suggest a significant opportunity in development of additional functionality appealing to these users. The demographic detail however shows this barrier is more prevalent in the 45+ age group, and lowest LSM group. Aspects of accessibility could therefore be considered to improve resolution.
Data Privacy and Security Concerns
A not inconsiderable 31% of respondents cited Data Privacy and Security Concerns as a service barrier, indicating that levels of trust vary. These findings are relatively consistent across demographic groupings.
In a related finding, 46% of respondents indicated feeling more distrustful or at risk during mobile / digital interactions, when compared to call-centre or face-to-face interactions. This highlights opportunity in user education, as well as use and positioning of technology to improve customer experience (see technology below).
Poor Digital / Online Service Options
29% of respondents indicated that Poor Digital / Online service Options where a barrier to usage. Unlike Unable to resolve via This Method, these findings was consistent across demographic groupings.
This could suggest a significant opportunity in development of additional functionality appealing to these users, and the need to understand unique customer journeys.
Preferences and Perception
Service Preference – Digital vs Traditional
In one of the most surprising findings, only 53% of respondents indicated that they would rather use digital service resolution over face-to-face methods or traditional call centres, provided all functionality was equal.
It is likely that this is finding is related to a feeling of distrust, or perceived risk aversion by a high percentage (46%) of respondents. It should however be noted that he preference for online service resolution varies by age, with younger age groups being more inclined to choose digital / mobile options.
It is also notable that the group within middle LSM 5-7 are most divided in terms of service preference. Interestingly, this group are differentiated by their interest in individualised and personalised services.
Drivers of Digital / Mobile Preference
While cost and service appear to be the dominant deciding factors for choosing digital / mobile options, the prospect of Personalised / individualised service is highly valued. Although peaks are seen in demographic detail, the findings are fairly well dispersed across age and LSM.
This insight, when read in conjunction with previous findings, indicate a significant opportunity for service refinement based on demographic data.
Customer-centricity & Innovation
Asked which industry they felt was most competitive and innovative in terms of Customer-centricity, Banks (38%) took a clear lead on Mobile Telephone Network Operators (18%). Online retailers followed closely behind with 17% of respondents choosing this industry, with other industries falling below 10%.
These scores, relatively low in the context of this survey, suggest that there is much room for differentiation, and improvement in creating unique customer-centred experiences.
Social Responsibility
One aspect of market positioning this survey explored was perceptions towards social causes. We asked respondents to rate the importance of a service providers public position (though advertising, promotions, donations etc.) on environmental (sustainability, pollution etc.) and social issues (crime, poverty, education etc.).
Response was overwhelming, with 62% of respondents indicating it was “Extremely Important”. This is specifically (although not exclusively) identified in the younger age groups, and middle LSM 5-7 segment, suggesting a growing trend.
Data Privacy
We asked respondents how much value they felt service providers placed on protecting their personal data, privacy, usage behaviour and other information from misuse or leaking the public / competitors.
Response was generally favourable to neutral, with Banks (86%) once again leading in perception. While Mobile Telephone Network Operators received the second highest favourable response (61%), they also had the highest unfavourable respondent rate (25%). This indicates a potential opportunity in brand positioning and value proposition development.
On average across industry, distrust in data privacy appears to increase with age and LSM, again suggesting more can be done to improve perception.
Technology
In an effort to assess perceptions relating to use of technology, we asked respondents to rate which of the following were most likely to improve customer experience: Artificial Intelligence (AI), Robotic Process Automation (RPA), and Chatbots.
Chatbots appear to familiar to most users, with 61% believing they will improve, and 30% saying they will worsen customer experience.
Support for Robotic Process Automation (RPA) at 53%, and Artificial Intelligence (AI) at 34%, is lower, with both displaying significant levels of detraction and unfamiliarity.
User Experience and Service Satisfaction
Mobile / Digital services are generally perceived to be functional, accessible, convenient, and easy to use. These categories show low levels of dissatisfaction, suggesting a broader consensus across various user groups.
Service interfaces and service variety also index more highly, when compared to greater dissatisfaction with Bundles & Specials and service chat functionality.
Customer Support and Response Time show more dissatisfaction, and less Extreme Satisfaction, indicating fewer “WOW” moments that might differentiate service.
INSIGHTS


